March was the third consecutive month in which Australian exports remained at record highs since early 2022. After A$49.50 and A$49.52 billion in January and February, traders reported A$49.45 billion for the last month of the first quarter. The big jump seems to be slowing down as many agencies pay special attention to the emerging plateau and the inability of exporters to cross the 50 billion psychological threshold in Australian Dollars. Even so, in March, we saw a significant improvement in the non-rural goods trade (up by 2%), mainly boosted by machinery (4%) and metal (11%, excl. non-monetary gold).
At the opposite pole, we see a decrease of 9% and 13% in traded volumes of cereal preparations and wool and sheepskins, respectively. This and a few other droppings in related industries caused a serious plunge of around 3% in the shipment of the rural goods down to under A$5.35 billion. Even worse are the non-monetary gold numbers in export, going down by 21% to around A$1.85 billion. The sale of services remains in the middle of the A$4.5 and A$5 billion, almost unchanged. All this makes us positive about the Australian export expectations on an annual basis.
Economy Profile

Despite the uprising trend from the beginning of 2022, we need to take a more detailed look at the AUS economy – export and import- to determine whether this growth is sustainable. Since 2016-17, the annual volume of two-way trade has constantly been increasing from A$736 to A$798 billion in 2017-18, and non-precedential A$874 billion in 2018-20. The Asian trade share increased from 65-66% to over 75% in just a couple of years, with China holding the largest piece of the pie. The Association of Southeast Asian Nations and Japan are the other two main partners of Australia within the region.
Proximity to Asian countries and established shipping routes are partially the reason for the increased trade. The economic profile of the country is complemented by export and import relations with Europe, North and South Americas. Combined, the two-way trade with the nations from these three continents was equal to the volumes realised with China. Among the top 10 trading partners are also the Republic of Korea, India, New Zealand, Thailand, and Singapore. Due to global supply chain problems caused by the covid pandemic and residual effects, trade dependencies between China and Australia have intensified.
Besides export and import, to determine the economical profile of Australia yet another crucial factor should be considered, and that’s online betting. Key statistics for the 2018-19 financial year include $6.6 billion in taxation revenue across all gambling sectors. Those include mostly online bookmakers in Australia, a full list of which can be found here.
Export – Overview
According to the Australian Trade and Investment Commission, the main export sectors remain Minerals and Fuels, Services, and Rural Commodities. Despite the sporadic downs of some sub-sectors, they have been steadily growing since 2017. For example, Minerals & Fuels expanded from slightly below A$190 to over A$210 billion in less than five years. Most of this volume is occupied by Iron Ores and Concentrates, with about 33%, Coal – 30%, and Natural Gas – 15%. The export of Aluminium is also growing at around 10% each year due to the increased demand, especially in China and the Asian region.
Despite the AUS export map changes, the sector of services remains the second largest, with over A$100 billion in 2020-21. A solid growth compared to the pre-pandemic value of A$90 and even lower. The Education-Related Travel and Personal Travel services were totalling around A$53 billion in 2017-18 and went almost to zero because of the 2020-21 lockdowns. Restrictions imposed by the government on the movement of people have almost completely ceased the activity of all companies in the sector. Fortunately, after their elimination, the industry recovered relatively quickly, overtaking other sectors and returning to second place.
The number of merchandise exporters is also recovering rapidly after the decline in 2020-21. After the historical peak (56,274 traders) in 2019-20, a year later was registered a double-digit decline. The trend is still at least 60% of all exporters to be small companies. More than 50% have 3 or fewer transactions per year, and 25%+ have 3 to 10 exports. The power traders locking and completing 51 or more deals on an annual basis are just around 10%. Of course, all this isn’t applicable for the companies involved in the Minerals & Fuels and Services export sectors, where most of the product is moved by large organisations.
Going back to the merchandise, we must mention the industries that took the hardest hit during the pandemic but also registered the highest rates of recovery. The Wholesale Trade is still the largest one, although it goes up slower than other business categories. The total number of companies is more than 50% higher than the second industry on the list – Manufacturing. In 2019-20 registered almost 14,000 wholesale traders were compared to 9,000 manufacturers. Retail Trade and Transport, Postal & Warehousing are the other largest independent sectors.
Largest Exporting States & Final Destinations
Besides the industries and involved parties, it’s crucial to trace the path of the exported product or services. Two of the states, New South Wales and Victoria, form almost 50% of the total exporters in Australia, exceeding 26,000 only in 2019. This is true for all industries, except mining, where the concentration of traders is mainly in Queensland and Western Australia. Here are the AUS states ranked by volume of export and top industries:
- New South Wales – cotton, livestock, and other industry products
- Victoria – food, fibre products, dairy
- South Australia – wheat, iron ore & concentrates, fruit and vegetables
- Queensland – coal, metals, sugar, meat
- Western Australia – iron ore, gold, petroleum, aluminium, wheat
- Tasmania – ores & concentrates, processed metals, meat, seafood.
If we connect these commodities with the countries of destination, we’ll complete this part of the Australian export map. China and the Asian region remain the biggest importers of AUS merchandise. Just before the pandemic outbreak, China itself reached a worth of A$150 billion, or around 40% of the total merchandise traded externally. Japan is in second place but by a large distance. In terms of transactions and the count of exporters involved, New Zealand continues to be the most likely destination!
Australian Import & Foreign Investments
The two-way trade and not only is completed when we take into consideration the Australian import industry too. Unlike export, it started 2022 at a slower pace tumbling a little compared to the last month of 2021. However, December is always a busy month, given the Christmas holidays. The total revenue hit a year high of A$37.73 billion, followed by almost A$37.1 billion in January 2022. February filled the open gap with record revenue of A$42.08 billion and A$40.14 billion for March. Despite the retreat of almost 2 billion AUD, the values give hope to market experts on this year’s trade balance.
Australia imports mainly transport equipment, vehicles, and machinery, which form around 40% of the total merchandise trade. Manufactured Goods, Petroleum, and Chemical-related Products follow with approximately 12%, 11%, and 10%, respectively. Australia’s major partners in terms of imports are not so different from export – China, the United States, Japan, Thailand, Malaysia, the Republic of Korea, and Germany. The country is also buying many services worth more than A$100 billion after the lockdown was revoked. Personal travel takes almost half of the whole revenue, growing from around A$43 billion from pre-pandemic times to almost A$50 billion in 2021. Freight transport, passenger transport, professional and business services combined form 28-30%.
Another look at the import by sector shows that Services fall to the third place after Intermediate Goods & Others (A$125 billion on average) and Consumption Goods (A$105 billion on average). The Capital Goods category is close to about A$75 billion. Surprisingly, the import of Gold shows rapid growth in the 2018 – 2020 period – from A$4.3 to over A$6.3 billion. Then again, given the general picture of rising imports and exports in almost all sectors, this doesn’t look so shocking anymore.
Australia’s Abroad & Foreign Investments
Foreign investments in the Australian economy raised up to A$4.1 trillion in 2021. The United States returned above А$1 trillion after a slight retreat in 2020 (A$927 billion). The United Kingdom and Belgium are second and third, with combined investments almost equal to those released by the US. However, they do worse compared to 2020, although their 5-year growth remains one of the highest – 8.5% and 8.5%, respectively. We see the biggest positive change in this indicator in Canada (13%), Norway (11.5%), and New Zealand (10.9%). However, their shares in absolute value for 2021 are just A$76.5, A$27.8, and A$69.1 billion.
On the flip side, we see more than A$3.3 trillion invested by Australia overseas. The balance is far from equal, but the upward trend continues in this part of the economy as well. Investment in the United States has grown by a whopping A$243 billion in just one year, from A$870 billion in 2020 to A$1.13 trillion at the end of 2021. The massive 28% change made the United States responsible for exactly one-third of the Australian direct investments abroad. However, Ireland (13th) and India (19th) performed even better. These countries accepted more than 45% and 30% more financing from Australian companies, up to A$46 and A$19.9 billion.
The top 5 AUS industries attracting the most investments in 2021 are Mining & Quarrying (A$360 billion), Real Estate (A$137 billion), Finance & Insurance (A$123 billion), Manufacturing (A$116 billion), and Wholesale & Retail Trade (A$61 billion). Compared to 2020, the biggest growth is in real estate (+ 13%), while the largest retreat is in manufacturing (-6.5%). Australian direct investment is most often targeted at companies in the following sectors: Finance & Insurance, Manufacturing, Mining, and Construction.
Trade Balance
The trade balance is the difference between exported and imported goods and services by a country for a certain period of time. The Australian economy has positive results in most months, which means that the value of its overseas sales exceeds purchases. According to the Department of Foreign Affairs and Trade, the AUS seasonally adjusted trade balance in March 2022 increased up to A$9.31 billion compared to A$7,46 billion a month earlier. Even so, it remains significantly under the January results of A$11.78 billion. These numbers increase the optimism of market analysts as they are significantly higher than in the same periods of previous years!
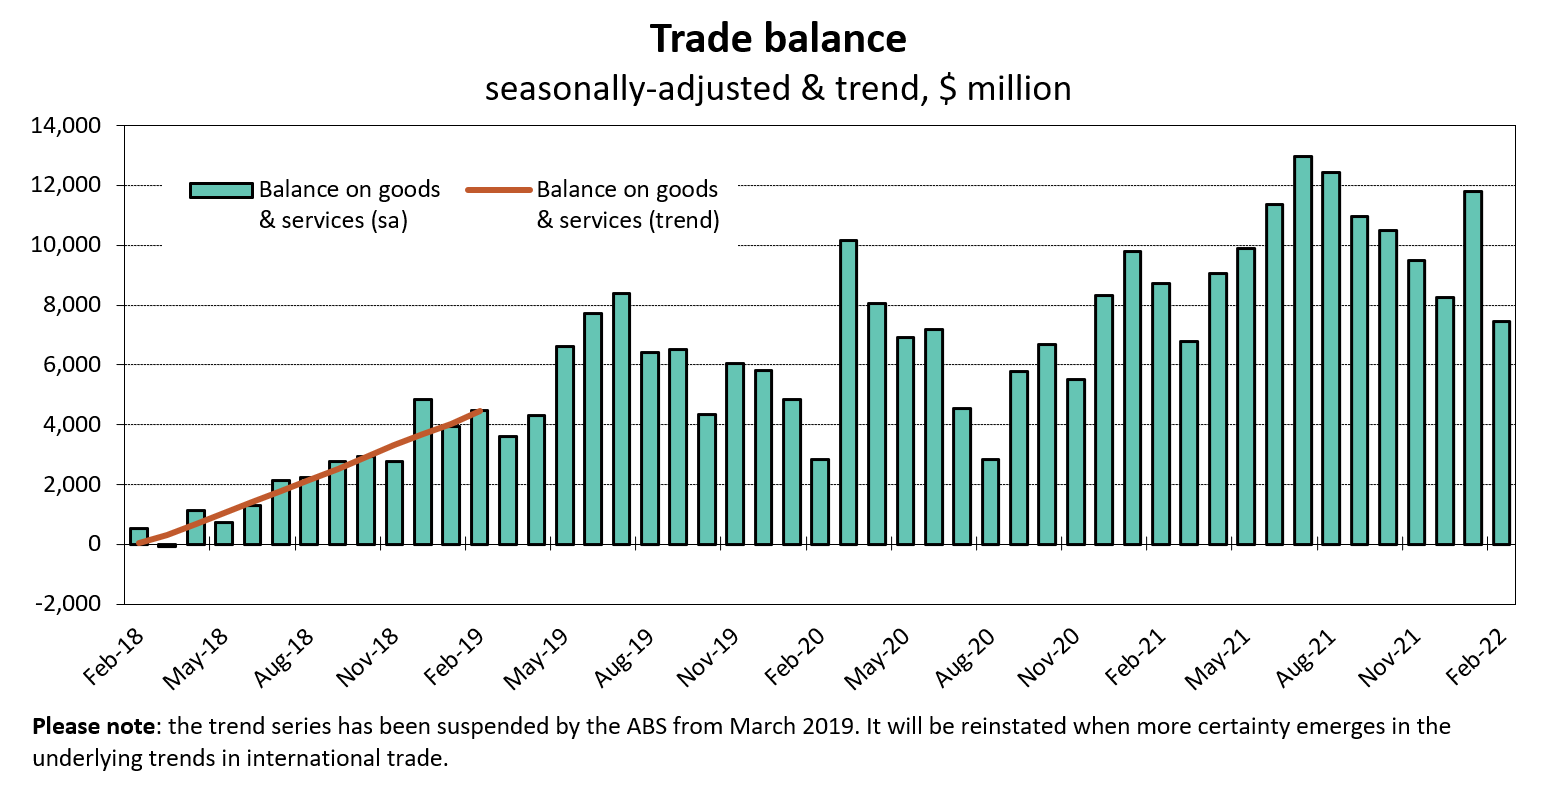
In fact, March 2018 was the last month with a negative trade balance of A$54 million seasonally adjusted. Of course, there were unexpected reasons for this, as the difference was seen in April 2018, when the balance returned to the green territory for exports, recording almost A$1.13 billion of revenue. Here are the March trade balance values before, during, and after the pandemic lockdown:
- 2018 – negative, A$54 million (seasonally adjusted)
- 2019 – positive, A$3.59 billion (seasonally adjusted)
- 2020 – positive, A$10.16 billion (seasonally adjusted)
- 2021 – positive, A$6.67 billion (seasonally adjusted)
- 2022 – positive, A$9.31 billion (seasonally adjusted).
One of the main reasons for the Australian positive trade balance is the constantly increasing deliveries of energy resources. Since 2017 the export of natural gas, coal, and coke and briquettes has been growing. The major trade surplus was registered with New Zealand and the Asian region, including China, Japan, Hong Kong, and Thailand. We can add metal ores, minerals, and rural goods to the same account. In fact, cereals and meat climb up, becoming one of the top-exported industry products. They are on the basis of the significantly enlarged number of trade deals with Australia’s weakest region, Tasmania.
On the other hand, the largest trade deficits were with other countries from the region – Singapore, Thailand, the Republic of Korea, Malaysia, and the United States. The positive trade balance is powered by the tourists’ return. We see doubled arrivals exceeding 161,000 in March 2020. The foreign direct investments are also growing up to almost A$33.4 billion. That corresponds directly with the increase in capital flows, although the balance there is still negative. If we look at the December 2021 reference, we’ll see less than -A$6.5 billion compared to -A$21.8 billion during the previous period.
Australian Trade – Changing Profile
In terms of two-way trade, China remains the main and most active partner of Australia. The huge economy and endless market of the Asian country swallows everything from everywhere and the only concern, in most cases, is the supply chain. Asia was responsible for 65.9% of the AUS two-way trade in 2017-18, 65.7% in 2018-19, and 65.2% in 2019-20. Experts expect the slide down to continue, mostly due to the strengthened relationship with Europe and the US. However, China has been increasing its volumes during these years, from A$194 billion to A$235 and A$251 billion, respectively.
For the same period, the United States has increased the turnover of goods and services by about A$10 billion, from A$70.2 to A$80.8 billion. That is rather surprising given the fact that the US targets mostly South America and Europe as trading territories. Still, the proximity of the Asian region is a major advantage for the countries from ASEAN. Europe has also powered its trade with Australia, and it’s now valued at A$128 billion compared with A$118 billion in 2017-18. Experts predict skyrocketing of all numbers in 2021-22 due to the rising inflation worldwide.
The fall can be clearly noticed in the trade between Australia and the Republic of Korea, India, Malaysia, and Thailand. All these countries were part of the top 10 of Australia’s two-way trading partners, but they seem to be losing ground for the last few years. Thailand even dropped out of the ranking, replaced by Germany. Its total turnover is now less than A$20 billion compared to around A$25 billion in 2017-18. This trend shows the strengthening of economic ties between Australia and richer countries very well. Regional relations and established channels are still important but are constantly weakening.
Look Into the Future
Given the current geopolitical situation and the difficulties most countries face due to post-pandemic and regional war conflicts, the trend we see is more likely to continue in the same direction. The United States is looking for new strategic partners and suppliers, so probably the export will be increased in the following 2 to 3 years. China is now more open than ever to trade with Russia and may slow down the pace in regard to Australian companies. However, the signed contracts and high quality of exported services will still fuel the two-way relationship.
Furthermore, tourism will boost the local economy and create conditions for foreign direct investment in developing regions, including Africa. In any case, global uncertainty about the supply of energy resources, as well as the restoration of delivery channels, will continue to limit and, therefore, stimulate the Australian economy to seek new markets.